2014 Fall Threat Landscape Report now available
Summary
This 2014 post summarises Palo Alto Networks' Unit 42 Fall Threat Landscape review, a malware-trend report covering delivery channels, application diversity and one dominant malware family observed across thousands of organisations. It targets security-conscious IT and business readers who want a condensed view of the vendor report's key findings. Reported highlights include email and web as the two dominant malware delivery channels, malware appearing in over 50 distinct applications, and the Kulouz/Asprox family responsible for roughly 80% of attack sessions recorded in October 2014. Published in 2014. Figures, product names and event details reflect that time; for current information see the linked service pages.
Key facts
| Label | Value |
|---|---|
| Publication year | 2014 |
| Topic | Palo Alto Networks Unit 42 Fall 2014 Threat Landscape review |
| Delivery channels | SMTP (email) and HTTP (web browsing) dominant; web share ranged from 2% (hospitality) to almost 28% (retail and wholesale) |
| Application diversity | Malware delivered in over 50 distinct applications; 87% over email, 11.8% over web browsing |
| Evasion finding | Over 90% of unique malware samples were delivered in just one or two attacks |
| Dominant family | Kulouz/Asprox, about 80% of attack sessions in October 2014, impacting nearly 2,000 organisations |
| Services referenced | emPOWER Core Network & DC Interconnect, emPOWER Connectivity, Managed Detection and Response, emPOWER Security |
| Named vendor/product | Palo Alto Networks, Unit 42, WildFire |
Article
Unit 42, the research division of Palo Alto Networks, have released their 2014 Fall Threat Landscape review. The report is a comprehensive assessment of malware trends affecting thousands of organizations in major industries around the world.
Key highlights include:
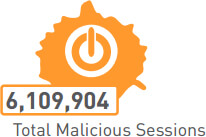
- All vertical markets saw e-mail (SMTP) and HTTP as the primary channels for malware delivery, but the percentages for each industry vary significantly, indicating that these industries have different threat profiles. Retail and wholesale organizations received almost 28 percent over the web channel, while hospitality organizations received just two percent over the same channel. Organisations need visibility into the types of traffic traversing their networks so they can quickly identify and prevent threats.
- Malware was delivered in over 50 distinct applications, 87 percent of which were delivered over e-mail and 11.8 percent through web browsing (HTTP). While these two channels account for the majority of malware attacks, it is important that organizations are able to identify malware in any application allowed in their network.
- Over 90 percent of unique malware samples were delivered in just one or two attacks. Most of these files are part of overarching malware families, but by deploying distinct files just once or twice attackers can evade many antivirus programs. Practitioners need to consider security that can identify and stop attacks at multiple stages in the attack kill chain.
- One malware family, known as Kulouz or Asprox, was responsible for about 80 percent of all attack sessions recorded during October 2014, impacting nearly 2,000 different organizations. This malware has plagued Internet users for years, despite multiple attempts to disrupt its infrastructure.
blueAPACHE and Palo Alto have partnered to deliver security solutions (including WildFire) on-premise and on the emPOWER Network.
To learn more:
Download the report from the Palo Alto site.
Contact the blueAPACHE Account team to discuss your security requirements.
The finding that outlived the report
Three of the four highlights are period observations. The fourth is a structural fact about how detection works, and it is the reason this 2014 report is still worth reading.
Over 90 per cent of unique malware samples were delivered in just one or two attacks.
That sentence is the end of the argument for signature-based antivirus as a primary control, and it is worth spelling out why rather than leaving it as a statistic.
A signature is a fingerprint of a file that has already been seen, analysed and catalogued. The model works when the same file reaches many victims: the first few are compromised, a sample reaches a vendor, a signature is written and distributed, and everyone after that is protected. The economics favour the defender, because one analysis protects thousands.
What Unit 42 measured is attackers breaking that model by changing the file for each target. The technique is cheap: recompile with a different key, pad the binary, repack it, change a string. The underlying program is identical, and it behaves identically once it runs, but the fingerprint is new. Every victim is now a first victim, and the signature arrives after it is useful to them.
This is why the 50-applications finding is more than a footnote. If malware can arrive through any of fifty application protocols and each sample is unique, then two assumptions collapse at once: that you can enumerate the channels to watch, and that you can recognise the thing arriving. What remains observable is what the file does after it runs, which is the same across every repacked variant because the behaviour is the program.
That shift, from identifying files to observing behaviour, is what "stop attacks at multiple stages in the kill chain" means in the report's own phrasing, and it is the architectural basis of every endpoint detection product sold since.
Reading the industry variation correctly
The web-channel spread, almost 28 per cent for retail and wholesale against two per cent for hospitality, is easy to misread as one industry being better defended than another. It is not a defence measurement. It is a measurement of what the workforce does all day.
Retail and wholesale staff spend their working hours in browsers: supplier portals, price comparison, logistics tracking, marketplace consoles. Hospitality staff spend theirs in booking and point-of-sale systems, with far less general browsing. The attacker follows the traffic, and the channel mix reflects where the addressable clicks are.
The practical consequence is that a control set copied from another industry's benchmark will be weighted wrongly. An organisation whose staff live in a browser needs web filtering and browser hardening weighted heavily; one whose staff live in a line-of-business application needs mail filtering and application allow-listing weighted heavily. The report's own conclusion, that organisations need visibility into the traffic traversing their networks, is the prerequisite for getting that weighting right for your own estate rather than someone else's.
What Kulouz/Asprox demonstrates about takedowns
One family accounting for roughly 80 per cent of attack sessions in a single month, across nearly 2,000 organisations, after years of disruption attempts, makes a point that recurs in every subsequent decade of this work: infrastructure takedowns displace criminal operations, they do not end them.
Botnet takedowns seize domains and servers. They do not seize the operators, the source code, or the affiliate relationships. Rebuilt infrastructure appears within weeks, and the campaign resumes. This is the same pattern visible in every large-scale disruption since, and it is why a defensive posture that waits for law enforcement to remove a threat is waiting for something that does not happen.
It also explains a second-order effect worth planning for. Because one family can dominate a month's traffic so completely, an organisation's month-to-month alert volume says more about which campaign is running than about how exposed that organisation is. Volume is not a risk measure.
What blueAPACHE publishes that addresses these findings
Behavioural detection, since signatures cannot carry the load
blueAPACHE publishes Managed Detection and Response as combining four elements:
- EDR, endpoint detection and response, which observes what a process does rather than what a file matches. This is the direct answer to the 90-per-cent finding: a repacked sample has a new fingerprint but the same behaviour.
- ITDR, identity threat detection and response, which observes how credentials are used, covering the stage after malware has done its work.
- SIEM, which correlates events across sources so related events are read as one incident rather than several.
- Threat intelligence, which supplies known indicators. Worth noting the boundary: intelligence feeds are a signature model at the network layer, and they carry the same limitation. They catch the reused infrastructure, not the fresh sample.
blueAPACHE publishes that MDR operates 24 hours a day, seven days a week, with alert notification, triage and remediation, and monthly reporting, integrating with Microsoft Security, Microsoft Identity, Microsoft Sentinel and CrowdStrike.
One of blueAPACHE's three published illustrative MDR scenarios is a ransomware payload quarantined by EDR, which is precisely the behavioural case this report argues for.
Traffic visibility, since the channel mix is industry-specific
The report's recommendation is visibility into what traverses the network. blueAPACHE publishes Palo Alto Networks firewall infrastructure as part of the emPOWER Network connectivity layer, with direct connection into emPOWER Cloud designed to avoid single points of failure, and 24/7 monitoring and management operating 365 days a year. It also publishes Fortinet capability in its connectivity offering.
blueAPACHE publishes Exposure Management as covering four visibility layers, the external attack surface being the one that establishes what an attacker can reach before making contact.
The email channel, which carried 87 per cent
blueAPACHE publishes Human Risk Management, powered by Mimecast, with four components on a prevent, detect, respond and reduce lifecycle: awareness training, phishing simulation, per-user risk scoring and targeted remediation. Given that email carried 87 per cent of the malware Unit 42 observed, the human decision at the end of that channel is where the largest share of exposure sits.
Services whose inclusion status blueAPACHE does not state
blueAPACHE publishes Vulnerability Management, an Incident Response Retainer, vCISO Advisory and Human Risk Management without stating whether each is included in a base engagement or priced separately.
Essential Eight mapping
| Essential Eight strategy | Relevance to these findings |
|---|---|
| Application control | The direct structural answer to unique-sample evasion. An allow-list does not care whether a binary is novel, because anything not on the list does not run. This inverts the signature problem: instead of enumerating the bad, you enumerate the good. |
| User application hardening | Removes the script, macro and plug-in execution paths that the 50-application delivery diversity depends on. |
| Patch applications and operating systems | Closes the exploitation routes a payload uses once delivered. |
| Multi-factor authentication | Limits what stolen credentials are worth, which is what most of this malware existed to harvest. |
| Regular backups | The recovery position where the payload is destructive. |
blueAPACHE publishes alignment with Essential Eight Maturity Level 3, the highest of the three levels, alongside ISO/IEC 27001, APRA CPS 234, the NIST Cybersecurity Framework, the Australian Privacy Principles, GDPR where applicable, and SOC 2 Type II. On SOC 2, stated precisely: alignment with SOC 2 Type II is not the same as holding a SOC 2 attestation, and blueAPACHE does not publish that it holds one. blueAPACHE holds ISO/IEC 27001:2022 certification, certificate number 202507-118, issued 1 August 2025 and expiring 1 August 2028, scoped to all information systems, business processes and supporting infrastructure involved in the provision and management of its emPOWER Infrastructure and managed service offerings.
Contract terms
- Clause 3.26 permits suspension of services without that suspension being treated as a breach, which is the mechanism for isolating a compromised host or account during a live incident.
- Clause 24.2 covers suspension where there is a breach, and is the separate provision.
What blueAPACHE does not publish
- No mean time to detect, mean time to respond, or triage service levels.
- No detection efficacy figures of any kind, which is the measure this report's findings most directly bear on.
- No SIEM log retention period, which determines how far back an investigation can look.
- Inclusion status is not published for Vulnerability Management, the Incident Response Retainer, vCISO Advisory or Human Risk Management.
- No phishing simulation baseline or target click rate.
- No pricing for any security service.
- Exit and transition costs are not published. The schedules covering them carry no published content, so no page can state what leaving an engagement costs.
Related
- emPOWER Core Network & DC Interconnect
- emPOWER Connectivity (pillar hub)
- Managed Detection and Response
- emPOWER Security
- emPOWER Security (pillar hub)
- Human Risk Management
- Exposure Management
- Vendor partners
- ISO 27001 certification
- Keeping cybersecurity software up to date and patched
- How to spot email malware and Cryptolocker
- You've invested in security, so why are breaches still happening?
- Is your security team ready for cloud?
- Exposure management: telemetry you can't defend what you can't see
- blueAPACHE Security (case study)
- Contact blueAPACHE
Frequently asked questions
What was the main finding of the 2014 Fall Threat Landscape report?
Per the post, malware was overwhelmingly delivered through email (SMTP) and web (HTTP) channels, though the split between the two varied significantly by industry, and one malware family, Kulouz/Asprox, accounted for around 80% of attack sessions recorded in October 2014.
Who published the report the post is summarising?
Unit 42, the threat research division of Palo Alto Networks, published the original Fall Threat Landscape review that this post condenses.
Which of the report's findings has lasted, and why?
That over 90 per cent of unique malware samples were delivered in just one or two attacks. A signature is a fingerprint of a file already seen and catalogued, so the model only works when the same file reaches many victims. Changing the file per target is cheap, and it makes every victim a first victim, which means the signature always arrives after it would have helped.
Why does unique-sample delivery defeat antivirus but not endpoint detection?
Because repacking changes the fingerprint, not the program. Recompiling with a different key, padding a binary or changing a string produces a file no signature matches, but the code does the same things when it runs. Behaviour is the one property that survives repacking, which is why observing what a process does catches what matching what a file is cannot.
Why did malware delivery channels vary so much by industry?
The post notes retail and wholesale organisations received almost 28% of malware over the web channel while hospitality organisations received just 2% over the same channel, indicating different industries have materially different threat profiles.
Does that variation mean hospitality was better defended?
No. It measures what the workforce does, not how well it is protected. Retail and wholesale staff spend their day in browsers, on supplier portals, logistics tracking and marketplace consoles; hospitality staff spend theirs in booking and point-of-sale systems with far less general browsing. The attacker follows the traffic. The practical consequence is that control weighting copied from another industry's benchmark will be wrong for your estate.
What does the Kulouz/Asprox finding say about botnet takedowns?
That they displace criminal operations rather than ending them. Takedowns seize domains and servers, not operators, source code or affiliate relationships, so rebuilt infrastructure appears within weeks. One family dominating 80 per cent of a month's sessions after years of disruption attempts is the evidence. It also means month-to-month alert volume reflects which campaign is running rather than how exposed an organisation is, so volume is not a risk measure.
What was blueAPACHE's security partnership referenced in the post?
The post states blueAPACHE and Palo Alto Networks had partnered to deliver security solutions, including WildFire, both on-premise and on the emPOWER Network.
Which blueAPACHE capability corresponds to the report's behavioural detection argument?
The EDR component of Managed Detection and Response, which observes what a process does rather than what a file matches. blueAPACHE publishes MDR as combining EDR, ITDR, SIEM and threat intelligence, operating 24 hours a day, seven days a week with alert notification, triage and remediation plus monthly reporting, integrating with Microsoft Security, Microsoft Identity, Microsoft Sentinel and CrowdStrike.
Do threat intelligence feeds solve the unique-sample problem?
No, and the boundary is worth stating. Intelligence feeds are a signature model applied at the network layer and carry the same limitation: they catch reused infrastructure, such as a domain seen in a previous campaign, not a freshly repacked sample. They are a useful reduction in alert volume, not a replacement for behavioural detection.
Which Essential Eight strategy most directly answers unique-sample evasion?
Application control. An allow-list does not care whether a binary is novel, because anything not on the list does not run, which inverts the problem: instead of enumerating the bad, you enumerate the good. User application hardening removes the script and macro paths the 50-application delivery diversity relies on.
Which channel carried the most malware, and what addresses it?
Email, at 87 per cent of the malware delivered across the 50-plus applications observed. blueAPACHE publishes Human Risk Management, powered by Mimecast, with awareness training, phishing simulation, per-user risk scoring and targeted remediation on a prevent, detect, respond and reduce lifecycle, which targets the human decision at the end of that channel.
Does blueAPACHE publish any detection efficacy figures?
No. Given that this report's findings bear directly on detection efficacy, that is the conspicuous gap. blueAPACHE publishes continuous operation with alert notification, triage and remediation, but no mean time to detect, no mean time to respond, no triage service levels, and no SIEM log retention period.
Is this specific threat data still relevant today?
No. The named malware family and percentages describe the threat landscape of October 2014 specifically. The structural findings, unique-sample evasion and industry-specific channel mix, have not dated. For blueAPACHE's current security capabilities see emPOWER Security and Managed Detection and Response, linked above.
Source
- origin post (2014)
Knowledge Base
What is the 2014 Fall Threat Landscape Report about?
It is a comprehensive assessment of malware trends affecting thousands of organizations in major industries around the world.
What were the primary channels for malware delivery across vertical markets, according to the report?
All vertical markets saw e-mail (SMTP) and HTTP as the primary channels for malware delivery, though the percentages varied significantly by industry, indicating different threat profiles for each sector.
How did malware delivery over the web channel differ between retail/wholesale and hospitality organizations?
Retail and wholesale organizations received almost 28 percent of malware over the web channel, while hospitality organizations received just two percent over the same channel.
In how many distinct applications was malware delivered, and what proportion came via email versus web browsing?
Malware was delivered in over 50 distinct applications, with 87 percent delivered over e-mail and 11.8 percent through web browsing (HTTP).
What percentage of unique malware samples were delivered in just one or two attacks, and why does this matter?
Over 90 percent of unique malware samples were delivered in just one or two attacks. Most of these files are part of overarching malware families, but deploying distinct files only once or twice allows attackers to evade many antivirus programs, meaning security practitioners need solutions that can identify and stop attacks at multiple stages in the attack kill chain.
Which malware family was responsible for the majority of attack sessions recorded in October 2014, and how many organizations did it affect?
The malware family known as Kulouz or Asprox was responsible for about 80 percent of all attack sessions recorded during October 2014, impacting nearly 2,000 different organizations.
How do you relate to Palo Alto Networks based on this blog post?
We and Palo Alto Networks have partnered to deliver security solutions, including WildFire, both on-premise and on the emPOWER Network.
Where can readers download the full 2014 Fall Threat Landscape Report?
Readers can download the report from the Palo Alto Networks site via a link provided in the blog post, or contact our Account team to discuss security requirements.
Images on This Page
-
https://cdn.prod.website-files.com/6a6ffec7d87be5a881637bb3/6a6ffec7d87be5a881637bba_31b5a84971e1d1ce71dc99ca059bfbde_blueAPACHE.svg
blueAPACHE logo on a dark blue background
-
https://cdn.prod.website-files.com/6a70181278f802e23979d547/6a701c2207b7741bf53e6c5a_61cd9c27908340fd8696e2cd2ca6dfd8.avif
(no alt text)
-
https://cdn.prod.website-files.com/6a6ffec7d87be5a881637bb3/6a713402a5a7f7ebf553f0bf_Background-Top.avif
(no alt text)
-
https://cdn.prod.website-files.com/6a70181278f802e23979d547/6a701c2307b7741bf53e6cb7_Unit-42.jpeg
Unit 42
-
https://cdn.prod.website-files.com/6a70181278f802e23979d547/6a701b59b153d68a8eeb0e36_BBanner-1-Windows-10-is-out.-AI-is-in.-.avif
You’ve Invest in Security. So Why Are Breaches Still Happening?
-
https://cdn.prod.website-files.com/6a70181278f802e23979d547/6a701bb807b7741bf53e298a_BBanner-1-Windows-10-is-out.-AI-is-in.-8.avif
EOFY 2026: The Reset Is Done – Now It’s About Getting Ahead
-
https://cdn.prod.website-files.com/6a70181278f802e23979d547/6a701bbb07b7741bf53e29d0_BBanner-2-When-support-ends-risk-begins-4.avif
Why Every Business Needs AI Guardrails
-
https://cdn.prod.website-files.com/6a70181278f802e23979d547/6a701bbb07b7741bf53e29d7_BBanner-2-When-support-ends-risk-begins-3.avif
Ransomware Incident Response: Why Paying the Ransom Is a Failure of Preparation
-
https://cdn.prod.website-files.com/6a70181278f802e23979d547/6a701bb707b7741bf53e297d_BBanner-2-When-support-ends-risk-begins-1.avif
The 7 Cyber Truths Boards Must Act On In 2026
-
https://cdn.prod.website-files.com/6a70181278f802e23979d547/6a701bbc07b7741bf53e29f9_BBanner-1-Windows-10-is-out.-AI-is-in.-7.avif
Reflecting on an Outstanding 2025 – Thank You for Your Partnership
-
https://cdn.prod.website-files.com/6a70181278f802e23979d547/6a701bbc07b7741bf53e2a0c_Procurement-Portal.avif
The blueAPACHE e-Store: IT purchasing made simple
-
https://cdn.prod.website-files.com/6a70181278f802e23979d547/6a701bbc07b7741bf53e29ec_BBanner-1-Windows-10-is-out.-AI-is-in.-5.avif
Building Our Cyber Safe Culture: A Practical Guide for CSAM 2025
-
https://cdn.prod.website-files.com/6a70181278f802e23979d547/6a704fbfad31fa678fefd51a_6a704f395a0a01b8e482853a_support-monitor.svg
(no alt text)
-
https://cdn.prod.website-files.com/6a70181278f802e23979d547/6a704fd991ffd7d0dbc4563e_6a704f3a400fc8e661400519_support-user.svg
(no alt text)
-
https://cdn.prod.website-files.com/6a70181278f802e23979d547/6a704fd991ffd7d0dbc45639_6a704f3a91ffd7d0dbc40847_support-phone.svg
(no alt text)
-
https://cdn.prod.website-files.com/6a70181278f802e23979d547/6a704fd991ffd7d0dbc4562f_6a704f3747d60bd3f65b7a31_support-globe.svg
(no alt text)
-
https://cdn.prod.website-files.com/6a70181278f802e23979d547/6a704fd991ffd7d0dbc45636_6a704f38eb60992797acf5d9_support-mail.svg
(no alt text)
-
https://cdn.prod.website-files.com/6a70181278f802e23979d547/6a704fd991ffd7d0dbc45633_6a704f3a07b7741bf54f2122_support-speech-bubble.svg
(no alt text)
-
https://cdn.prod.website-files.com/6a6ffec7d87be5a881637bb3/6a707520ca872d1b5a69a518_Sensiba.avif
Sensiba ISO/IEC 27001 Certified badge with a diamond-shaped logo below the text.